ADNI Clinical Progression
ATRI Biostatistics
Progression.RmdADNI progression summaries using the ADNIMERGE R package
Description
This package vignette demonstrates how to use the ADNIMERGE package to generate progression summaries and plots with R and knitr.
Report generated from Progresssion.Rmd
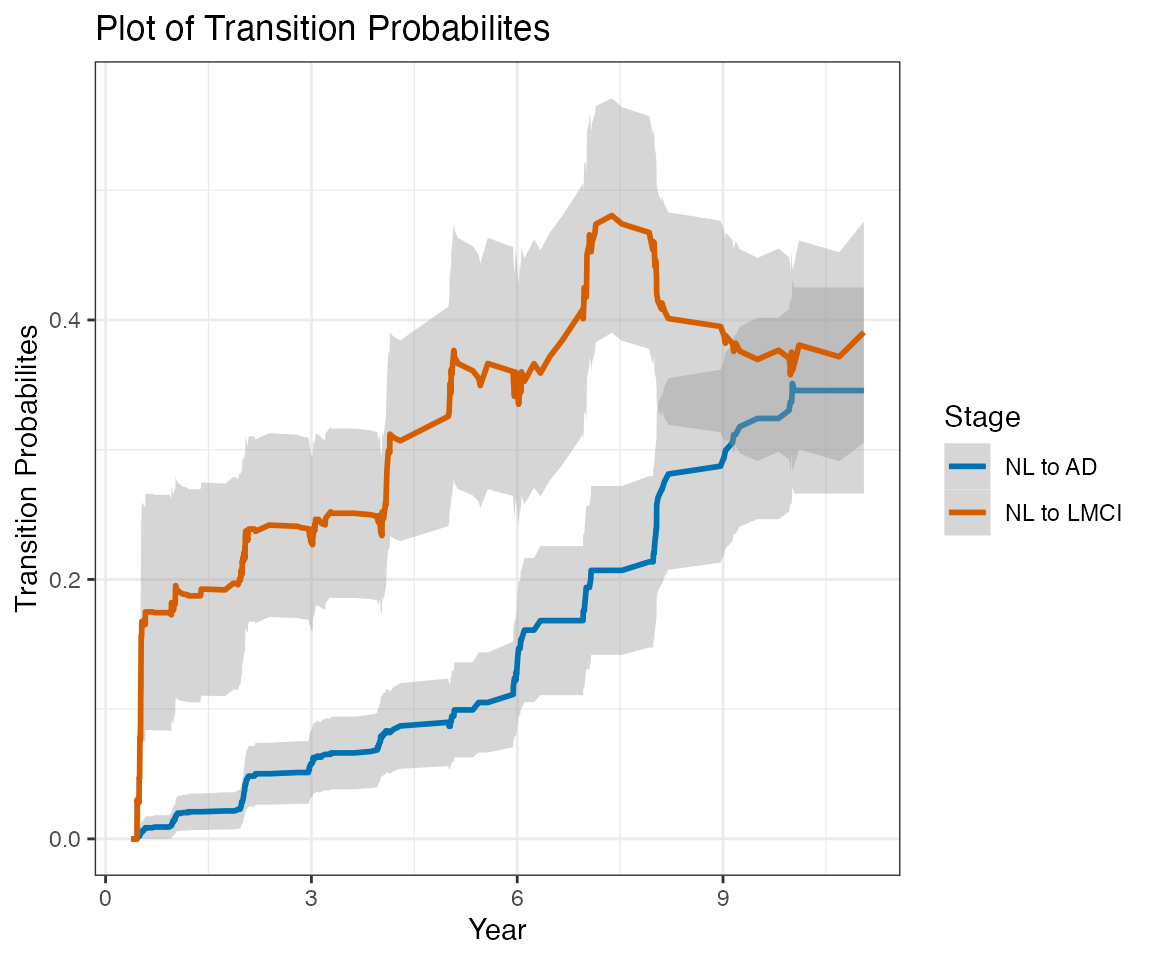
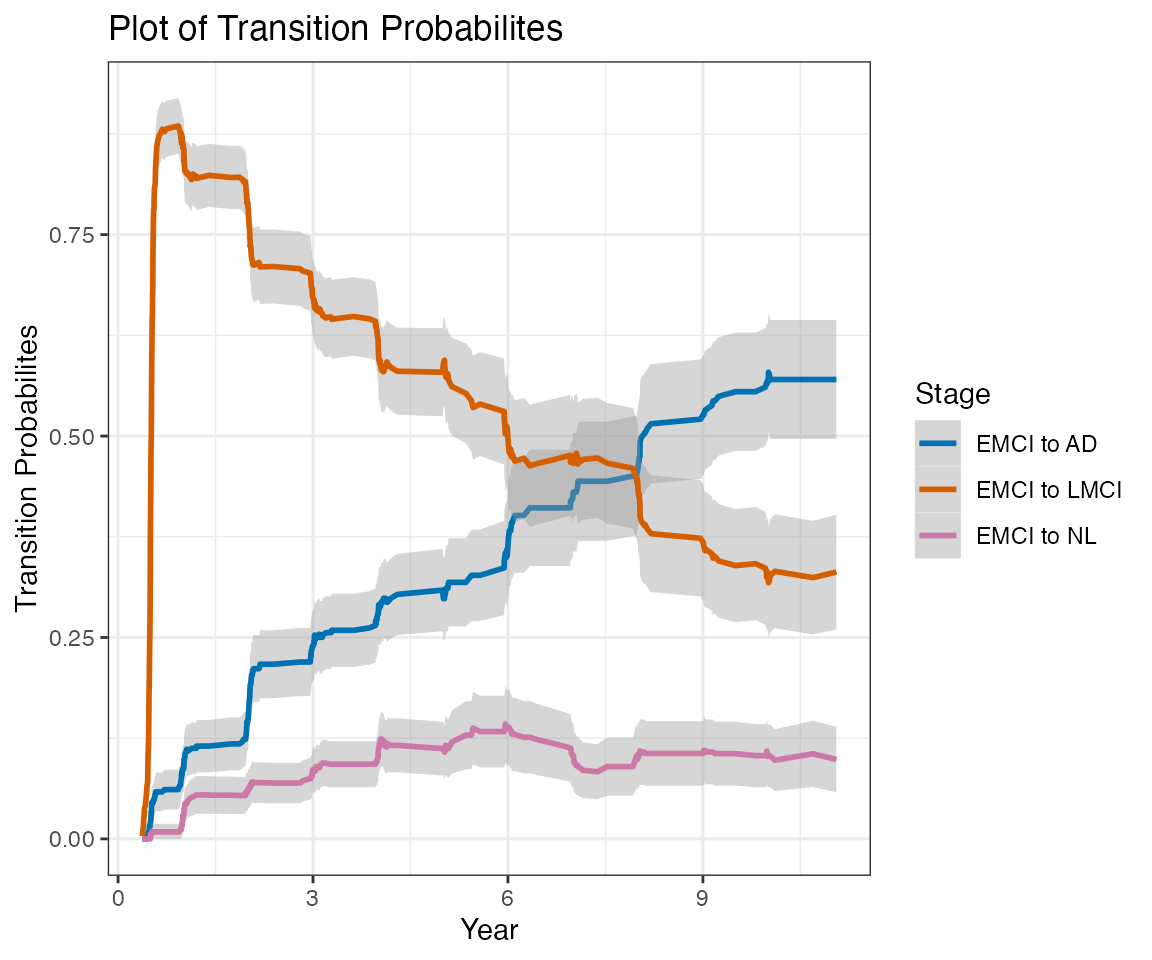
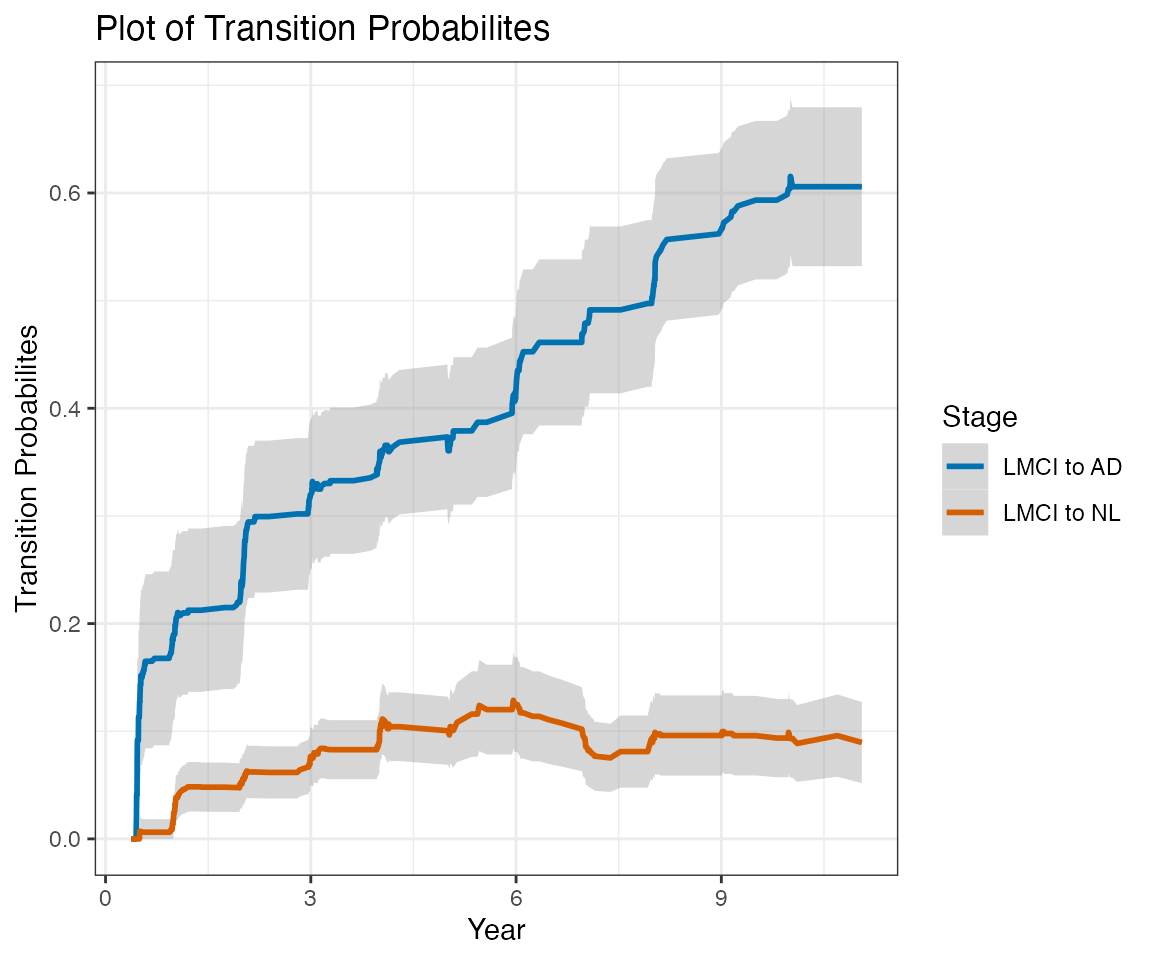
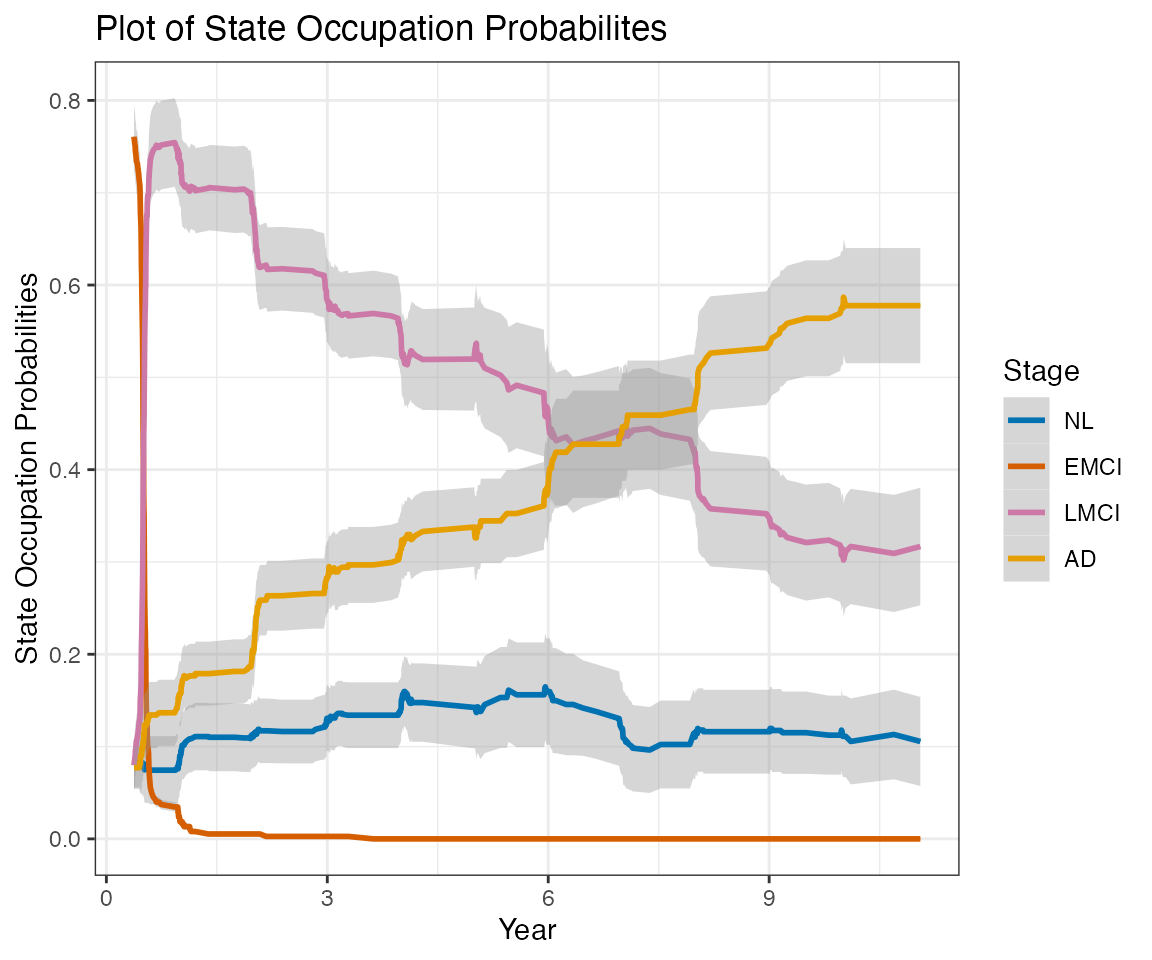
This report contains estimates of the ADNI conversion rates using a nonparametric multistate modeling approach (Nicole Ferguson, Somnath Datta, Guy Brock (2012). msSurv: An R Package for Nonparametric Estimation of Multistate Models. Journal of Statistical Software, 50(14), 1-24. http://www.jstatsoft.org/v50/i14/).
This report does not consider transition to EMCI at any followup visits. The label LMCI, when applied at followup visits, actually refer to any MCI (EMCI or LMCI).
Only subjects with at least one followup Diagnostic Summary are included in this report.
Load required R packages and functions
options(digits = 3)
library(knitr)
library(ADNIMERGE)
library(Hmisc)
library(msSurv)
library(zoo)
library(ggplot2)
theme_set(theme_bw())
source("http://adni.bitbucket.io/myfunctions.R")

cbbPalette <- c("#0072B2", "#D55E00", "#CC79A7", "#E69F00", "#56B4E9", "#009E73",
    "#F0E442", "#000000")
scale_colour_discrete <- function(...) scale_colour_manual(..., values = cbbPalette)
scale_fill_discrete <- function(...) scale_fill_manual(..., values = cbbPalette)
No states eligible for entry distribution calculation.

Exit distributions calculated for states 2 .

Using bootstrap to calculate variances ...
Transition counts (all intermediate transitions)
           end.stage
start.stage   NL EMCI LMCI   AD  Sum
       NL    354    0   87    1  442
       EMCI    2    0  281    4  287
       LMCI   61    0  364  157  582
       AD      0    0   19  282  301
       Sum   417    0  751  444 1612
Transition counts (first to last stage transitions)
           end.stage
start.stage   NL EMCI LMCI   AD  Sum
       NL    348    0   48   14  410
       EMCI   26   17  224   37  304
       LMCI   11    0  155   93  259
       AD      0    0    1  231  232
       Sum   385   17  428  375 1205
Transition probabilities (%)
Year 0 to 1
         NL EMCI   LMCI     AD Sum
NL   79.048 0.00  18.99   1.96 100
EMCI  4.908 1.74  82.38  10.97 100
LMCI  4.336 0.00  74.92  20.74 100
AD    0.142 0.00   5.23  94.63 100
Sum  88.435 1.74 181.52 128.30 400
Year 0 to 2
        NL  EMCI   LMCI     AD Sum
NL   71.28 0.000  23.89   4.84 100
EMCI  6.98 0.697  71.20  21.13 100
LMCI  6.22 0.000  64.34  29.44 100
AD    0.37 0.000   8.03  91.60 100
Sum  84.84 0.697 167.46 147.01 400